Thursday, February 27, 2025

Mobileum Launches RAID 9: A Transformative Approach to Telecom Risk Management

CUPERTINO, Calif. - Wednesday, 26. February 2025


Revolutionizing Collaboration Across Teams for Financial Assurance and Risk Mitigation in Telecom Operators


(BUSINESS WIRE) -- Mobileum Inc. (“Mobileum”), a leading global provider of analytics and network solutions, is thrilled to announce the release of RAID 9, the latest evolution of its industry-leading risk management platform. Building on the strong foundation of previous RAID versions, RAID 9 introduces groundbreaking advancements designed to automate revenue assurance, fraud management, and financial compliance. With enhanced risk mapping and advanced data analytics, RAID 9 empowers CFOs and audit teams to improve operational efficiency while tackling complex risk and regulatory challenges.


The Challenge: Complexities in Telecom Risk Management


Telecom operators today face shrinking profit margins, a rapidly evolving technology landscape, dynamic regulatory environments, and fragmented operations. Traditional risk management methods, often siloed and narrowly focused on data analytics, fail to address the multi-faceted nature of telecom risk. Effective solutions now demand collaboration across risk management, business, auditing, and IT teams, which often rely on disparate tools and systems to bridge organizational gaps.


Adding to these challenges, telecom operators navigate a uniquely intricate risk landscape shaped by macroeconomic uncertainties, geopolitical shifts, and operational complexities. Emerging risks in areas such as technology, strategy, finance, and compliance continuously push the boundaries of traditional mitigation strategies, threatening to disrupt operations without effective solutions in place.


The Solution: RAID 9’s Unified Platform


RAID 9 addresses these challenges head-on, offering a unified platform that combines:


Real-Time Data Analytics: Processes vast amounts of data instantly to detect anomalies, identify patterns, and enable proactive threat prevention.


Advanced Risk Mapping: Features an industry-leading risk catalog with over 5,000 telecom-specific risks, updated regularly to reflect the latest frameworks and threats.


Integrated Collaboration: Breaks down silos between teams, fostering seamless communication and coordinated risk management efforts.


This holistic approach ensures streamlined operations, regulatory compliance, and actionable insights, helping telecom operators make informed decisions and respond to threats more effectively.


Harnessing AI for Financial Integrity


RAID 9 leverages AI-driven analytics to:


Enhance Revenue Assurance and Fraud Detection: Identifies irregularities with unmatched precision, reducing manual oversight and enabling rapid responses.


Correct Financial Errors: Automates error detection and resolution to improve financial accuracy and integrity.


Optimize Compliance: Keeps pace with evolving regulations, ensuring adherence with minimal operational disruption.


“RAID 9 is a game-changer for telecom risk management,” said Carlos Marques, Head of Product at Mobileum. “Building on the success of previous RAID versions, this release combines a comprehensive risk catalog with advanced analytics in a unified platform, enabling teams to strengthen operational resilience and manage risk more effectively.”


Seamless Adoption and Proven Impact


Telecom operators and Mobileum consulting partners can easily get started with RAID 9 through a readily available trial. This provides an opportunity to explore its full capabilities and experience its transformative benefits firsthand.


“RAID 9 marks a major advancement in telecom risk management, breaking down silos and enabling a more collaborative, data-driven approach to mitigating fraud, revenue leakage, security, and compliance risks,” said José Sobreira, Director of Risk, Fraud, and Security at Unitel Angola and Chair of GSMA Africa Fraud and Security Group (AFASG). “By integrating advanced analytics with a comprehensive risk framework, RAID 9 empowers operators to proactively address emerging threats, strengthen resilience, and enhance financial integrity."


Transform Your Risk Management Today


To learn how RAID 9 can revolutionize your approach to risk management and drive success in today’s complex telecom landscape, book a meeting with Mobileum at Mobile World Congress in Hall 2, Booth 2J50. To request a personalized demonstration or start your free trial, visit RAID 9.


About Mobileum Inc.


Mobileum is a leading provider of Telecom analytics solutions for roaming, core network, security, risk management, domestic and international connectivity testing, and customer intelligence. More than 1,000 customers rely on its Active Intelligence platform, which provides advanced analytics solutions, allowing customers to connect deep network and operational intelligence with real-time actions that increase revenue, improve customer experience, and reduce costs. Headquartered in Silicon Valley, Mobileum has global offices in Australia, Germany, Greece, India, Japan, Portugal, Singapore, UK, and United Arab Emirates.


Learn more at https://www.mobileum.com/.


View source version on businesswire.com: https://www.businesswire.com/news/home/20250226433206/en/


Permalink

https://www.aetoswire.com/en/news/2602202545016


Contacts

Useful Contacts:


Risk Management Product Management

Carlos Marques | carlos.marques@mobileum.com | Mob.: +351 939650124


Media and Corporate Communications

Sandra Almeida | sandra.almeida@mobileum.com | Mob. +351 939650229

BeiGene Announces Fourth Quarter and Full Year 2024 Financial Results and Business Updates


SAN MATEO, Calif. - 

Total global revenues of $1.1 billion and $3.8 billion for the fourth quarter and full year, increases of 78% and 55%, respectively; narrowed GAAP operating loss and achieved full-year positive non-GAAP operating income

Global BRUKINSA revenues of $828 million and $2.6 billion for the fourth quarter and full year, increases of 100% and 105%, respectively; progressed pivotal-stage programs for BCL2 inhibitor sonrotoclax and BTK CDAC BGB-16673

Advanced six and 13 New Molecular Entities (NMEs) into the clinic in the fourth quarter and full year, respectively; anticipate multiple data readouts for innovative solid tumor programs in 1H 2025

Full year 2025 revenue guidance of $4.9 billion to $5.3 billion, reaffirm anticipated positive GAAP operating income and cash flow generation from operations in 2025


(BUSINESS WIRE) -- BeiGene, Ltd. (NASDAQ: ONC; HKEX: 06160; SSE: 688235), a global oncology company that intends to change its name to BeOne Medicines Ltd., today announced financial results and corporate updates from the fourth quarter and full year 2024.


“Our fourth quarter and full year results demonstrate our tremendous growth as a global oncology powerhouse, reinforced by the continued success of BRUKINSA and the development of one of the most prolific solid tumor pipelines in oncology with multiple data readouts expected this year,” said John V. Oyler, Co-Founder, Chairman, and CEO at BeiGene. “BRUKINSA is now the unequivocal leader in new CLL patient starts in the U.S., holds the broadest label of any BTK inhibitor and serves as the cornerstone of our hematology franchise, showing immense promise as a backbone alongside our late stage BCL2 inhibitor, sonrotoclax, and our potential first-in-class BTK CDAC. We are also building future solid tumor franchises in breast, lung, and gastrointestinal cancers by leveraging our platforms in multi-specific antibodies, protein degraders and antibody-drug conjugates. 2025 marks an inflection point as we anticipate achieving positive GAAP operating income and operating cash flow alongside our intention to change our name to BeOne with our new NASDAQ ticker, ONC.”


Fourth Quarter and Full Year 2024 Financial Snapshot


(Amounts in thousands of U.S. dollars and unaudited)


Fourth Quarter


Full Year


2024


2023


% Change


2024


2023


% Change


Net product revenues


$


1,118,035


$


630,526


77


%


$


3,779,546


$


2,189,852


73


%


Net revenue from collaborations


$


9,789


$


3,883


152


%


$


30,695


$


268,927


(89


)%


Total revenue


$


1,127,824


$


634,409


78


%


$


3,810,241


$


2,458,779


55


%


GAAP loss from operations


$


(79,425


)


$


(383,795


)


(79


)%


$


(568,199


)


$


(1,207,736


)


(53


)%


Adjusted income (loss) from operations*


$


78,603


$


(267,224


)


129


%


$


45,356


$


(752,473


)


106


%


* For an explanation of our use of non-GAAP financial measures refer to the "Note Regarding Use of Non-GAAP Financial Measures" section later in this press release and for a reconciliation of each non-GAAP financial measure to the most comparable GAAP measures, see the table at the end of this press release.


Key Business Updates


BRUKINSA® (zanubrutinib) is an orally available, small molecule inhibitor of BTK designed to deliver complete and sustained inhibition of the BTK protein by optimizing bioavailability, half-life, and selectivity. With differentiated pharmacokinetics compared with other approved BTK inhibitors, BRUKINSA has been demonstrated to inhibit the proliferation of malignant B cells within a number of disease-relevant tissues. BRUKINSA has the broadest label globally of any BTK inhibitor and is the only BTK inhibitor to provide the flexibility of once or twice daily dosing. The BRUKINSA clinical development program includes approximately 7,100 patients enrolled to date in more than 30 countries and regions across more than 35 trials. BRUKINSA is approved in more than 70 markets, and more than 180,000 patients have been treated globally.


U.S. sales of BRUKINSA totaled $616 million and $2.0 billion in the fourth quarter and full year of 2024, representing growth of 97% and 106%, respectively, over the prior-year periods, with more than 60% of the quarter-over-quarter demand growth coming from expanded use in chronic lymphocytic leukemia (CLL) as BRUKINSA continued to gain share as the leader in new patient starts in the U.S. in CLL and all other approved indications; BRUKINSA sales in Europe totaled $113 million and $359 million in the fourth quarter and full year 2024, representing growth of 148% and 194%, respectively, compared to the prior-year periods, driven by increased market share across all major markets, including Germany, Italy, Spain, France and the UK; and


Entered into a patent litigation settlement agreement with MSN Pharmaceuticals, Inc. and MSN Laboratories Private Ltd. granting MSN the right to sell a generic version of BRUKINSA in the U.S. no earlier than June 15, 2037, subject to potential acceleration or extension under circumstances customary for settlement of this type.


TEVIMBRA® (tislelizumab) is a uniquely designed humanized immunoglobulin G4 (IgG4) anti-programmed cell death protein 1 (PD-1) monoclonal antibody with high affinity and binding specificity against PD-1; it is designed to minimize binding to Fc-gamma (Fcγ) receptors on macrophages, helping to aid the body’s immune cells to detect and fight tumors. TEVIMBRA is the foundational asset of BeiGene’s solid tumor portfolio and has shown potential across multiple tumor types and disease settings. The TEVIMBRA clinical development program includes almost 14,000 patients enrolled to date in 35 counties and regions across 70 trials, including 21 registration-enabling studies. TEVIMBRA is approved in 45 markets, and more than 1.3 million patients have been treated globally.


Sales of tislelizumab totaled $154 million and $621 million in the fourth quarter and full year 2024, representing growth of 20% and 16%, respectively, compared to the prior-year periods;


Received U.S. Food and Drug Administration (FDA) approval in combination with platinum and fluoropyrimidine-based chemotherapy for the first-line treatment of unresectable or metastatic HER2-negative gastric or gastroesophageal junction adenocarcinoma in adults whose tumors express PD-L1 (≥1); and


Received European Commission (EC) approval in combination with chemotherapy for the first-line treatment of esophageal squamous cell carcinoma and gastric or gastroesophageal junction adenocarcinoma.


Key Pipeline Highlights


BeiGene’s portfolio strategy emphasizes rapid generation of early-stage clinical proof-of-concept data enabled by its speed- and cost-advantaged (“Fast to Proof of Concept”) approach to global development operations. The Company’s in-house global research and development team, including clinical operations and development, is comprised of nearly 3,700 colleagues conducting trials across six continents and striving to ensure rigorous data quality through collaborations with regulators and investigators in over 45 countries. This strategic approach maximizes resources by channeling data-gated investments into the most promising clinically differentiated candidates quickly and de-prioritizing others. With one of the largest oncology research teams in the industry, BeiGene has demonstrated strengths in translational small molecule and biologics discovery, including three platform technologies: multi-specific antibodies, chimeric degradation activation compounds (CDACs), and antibody-drug conjugates (ADCs).


Hematology


BRUKINSA


At the American Society of Hematology (ASH) Annual meeting, presented 5-year follow-up from SEQUOIA study; with adjustment for COVID-19 impact, the study demonstrated treatment with BRUKINSA reduced the risk of progression or death by 75% compared to bendamustine-rituximab in patients with treatment-naïve (TN) CLL;


Anticipate FDA and EC approvals of BRUKINSA tablet formulation in the second half of 2025;


Anticipate an interim analysis of progression-free survival for the Phase 3 MANGROVE study in TN mantle cell lymphoma (MCL) in the second half of 2025; and


Anticipate completing enrollment for the relapsed/refractory (R/R) follicular lymphoma portion of the Phase 3 MAHOGANY study in the second half of 2025.


Sonrotoclax (BCL2 inhibitor)


Planned data readouts in R/R CLL and R/R MCL Phase 2 trials and potential accelerated approval submissions in the second half of 2025;


At ASH, presented data from the 320 mg expansion cohort of a Phase 1/1b study at a median follow-up of 1.5 years demonstrating no progression in patients with TN CLL in combination with BRUKINSA;


More than 1,800 patients enrolled to date across the program;


Completed enrollment in Phase 3 CELESTIAL study in TN CLL;


Anticipate enrolling first subjects in global Phase 3 trials in R/R CLL and R/R MCL in the first half of 2025; and


Continued enrollment in global Phase 2 trial in Waldenström’s macroglobulinemia.


BGB-16673 (BTK CDAC)


Continued to enroll potentially registration enabling R/R CLL Phase 2 study with data readout expected in 2026;


More than 500 patients enrolled to date across the program;


Anticipate initiation of Phase 3 trial in R/R CLL compared to physician’s choice in the first half of 2025; and


Anticipate initiation of Phase 3 head-to-head trial against noncovalent BTK inhibitor pirtobrutinib in R/R CLL in the second half of 2025.


Solid Tumors


Anticipate data readouts for BGB-43395 (CDK4 inhibitor), BG-68501 (CDK2 inhibitor) and BG-C9074 (B7H4 ADC) in the first half of 2025, and internal proof-of-concept data for BG-60366 (EGFR CDAC), BGB-53038 (panKRAS inhibitor), BG-C137 (FGFR2b ADC), BGB-C354 (B7H3 ADC), and BG-C477 (CEA ADC) in the second half of 2025.


Lung Cancer


Tarlatamab (AMG757, DLL3xCD3 BiTE): anticipate data readout from Phase 3 study in second-line small cell lung cancer in the first half of 2025;


Advan-TIG-302 (TIGIT antibody): anticipate interim data readout from Phase 3 study in first-line PD(L)1-high non small cell lung cancer in the second half of 2025;


BG-60366 (EGFR CDAC): entered into the clinic in the fourth quarter of 2024; differentiated degrader mechanism to completely abolish EGFR signaling; highly potent across osimertinib-sensitive and resistant EGFR mutations; strong preclinical efficacy data with oral and daily dosing;


BG-89894 (MAT2A inhibitor): entered dose escalation in fourth quarter of 2024; potential best-in-class characteristics with superior potency and brain penetration; strong synergy between PRMT5i and MAT2Ai in preclinical models;


BGB-58067 (MTA-cooperative PRMT5 inhibitor): entered into the clinic in the beginning of January 2025; best-in-class potential with high potency, selectivity, and brain penetrability; and


BG-T187 (EGFR x MET trispecific antibody): initiated dose escalation in fourth quarter of 2024; differentiated MET biparatopic design with optimal MET inhibitory activity to pursue best-in-class opportunity.


Breast and Gynecologic Cancers


BGB-43395 (CDK4 inhibitor): continued dose escalation in monotherapy and in combination with fulvestrant and letrozole in the anticipated efficacious dose range; more than 180 patients enrolled to date and proof-of-concept expected in the first half of 2025; planning underway for Phase 3 trial in second-line HR+/HER2- metastatic breast cancer in combination with endocrine therapy; and


BG-68501(CDK2 inhibitor) and BG-C9074 (B7H4 ADC): continued monotherapy dose escalation; more than 50 patients and more than 70 patients enrolled to date, respectively.


Gastrointestinal Cancers


Zanidatamab (HER2 bispecific antibody) in combination with tislelizumab and chemotherapy: anticipate primary PFS data readout from Phase 3 study in first-line HER2-positive gastroesophageal adenocarcinoma in the second half of 2025; and


NMEs advanced into the clinic in the fourth quarter of 2024:


BGB-53038 (panKRAS inhibitor): highly potent and selective with broad activity against KRAS mutations in multiple tumor types; limits toxicity by sparing other RAS proteins; KRAS mutations are present in 19 percent of cancers; and


BG-C137 (FGFR2b ADC): potential first-in-class ADC for a validated target in upper gastrointestinal and breast cancers; potential superior efficacy compared to leading monoclonal antibody in both high- and medium-expression models.


Inflammation and Immunology


BGB-45035 (IRAK4 CDAC): currently in dose escalation in both SAD and MAD cohorts with more than 130 subjects enrolled; potent and selective degrader that targets both kinase and scaffold functions of IRAK4 for complete target degradation; Phase 2 study planned in 2025; proof-of-concept for tissue IRAK4 degradation in the second half of 2025.


Corporate Updates


Announced intent to change the Company’s name to BeOne Medicines, pending shareholder approval; the new name reflects the Company’s commitment to develop innovative medicines to eliminate cancer by partnering with the global community to serve as many patients as possible;


Announced a global licensing agreement with CSPC Zhongqi Pharmaceutical Technology (Shijiazhuang) Co., Ltd. for SYH2039 (BG-89894), a novel MAT2A inhibitor being explored for solid tumors as monotherapy and in combination with BGB-58067 (MTA-cooperative PRMT5 inhibitor);


Changed the Company’s Nasdaq stock ticker from “BGNE” to “ONC”; and


Hosted an investor webinar on December 16, 2024, highlighting key data from the hematology franchise from the ASH 2024 and the 2024 San Antonio Breast Cancer Symposium and presented at the 2025 J.P. Morgan Healthcare Conference on January 13, 2025. Replays and materials can be found at the Investor Events and Presentations section of the Company’s website.


Fourth Quarter and Full Year 2024 Financial Highlights


Revenue for the fourth quarter and full year 2024 was $1.1 billion and $3.8 billion, respectively, compared to $634 million and $2.5 billion in the prior-year periods driven primarily by growth in BRUKINSA product sales in the U.S. and Europe.


Product Revenue totaled $1.1 billion and $3.8 billion for the fourth quarter and full year 2024, respectively, compared to $631 million and $2.2 billion in the prior-year periods. The increase in product revenue was primarily attributable to increased sales of BRUKINSA. For the quarter and full year 2024, the U.S. was the Company’s largest market, with product revenue of $616 million and $2.0 billion, respectively, compared to $313 million and $946 million, respectively, in the prior-year periods. U.S. sales were also positively impacted in the fourth quarter of 2024 by seasonality and the timing of customer order patterns of approximately $30 million. In addition to BRUKINSA revenue growth, product revenues were positively impacted by growth from in-licensed products from Amgen and tislelizumab.


Gross Margin as a percentage of global product sales for the fourth quarter and full year 2024 was 85.6% and 84.3%, respectively, compared to 83.2% and 82.7% in the prior-year periods on a GAAP basis. The gross margin percentage increased in both the quarter-over-quarter and year-over-year periods due to a proportionally higher sales mix of global BRUKINSA compared to other products in our portfolio, partially offset by the impact of accelerated depreciation expense of $16 million and $33 million, respectively, for the fourth quarter and full year 2024 resulting from the move to more efficient, larger scale production lines for tislelizumab. On an adjusted basis, which does not include the accelerated depreciation, gross margin as a percentage of product sales increased to 87.4% and 85.5% for the fourth quarter and full year 2024, respectively, compared to 83.7% and 83.2%, respectively, in the prior-year periods.


Operating Expenses


The following table summarizes operating expenses for the fourth quarter 2024 and 2023, respectively:


GAAP


Non-GAAP


(in thousands, except percentages)


Q4 2024


Q4 2023


% Change


Q4 2024


Q4 2023


% Change


Research and development


$542,012


$493,987


10%


$474,874


$437,383


9%


Selling, general and administrative


$504,677


$418,385


21%


$433,059


$361,435


20%


Total operating expenses


$1,046,689


$912,372


15%


$907,933


$798,818


14%


The following table summarizes operating expenses for the full year 2024 and 2023, respectively:


GAAP


Non-GAAP


(in thousands, except percentages)


FY 2024


FY 2023


% Change


FY 2024


FY 2023


% Change


Research and development


$1,953,295


$1,778,594


10%


$1,668,368


$1,558,960


7%


Selling, general and administrative


$1,831,056


$1,508,001


21%


$1,549,864


$1,284,689


21%


Total operating expenses


$3,784,351


$3,286,595


15%


$3,218,232


$2,843,649


13%


Research and Development (R&D) Expenses increased for the fourth quarter and full year 2024 compared to the prior-year periods on both a GAAP and adjusted basis primarily due to advancing preclinical programs into the clinic and early clinical programs into late stage. Upfront fees and milestone payments related to in-process R&D for in-licensed assets totaled $63 million and $114 million in the fourth quarter and full year 2024, respectively, compared to $31.8 million and $46.8 million in the prior-year periods.


Selling, General and Administrative (SG&A) Expenses increased for the fourth quarter and full year 2024 compared to the prior-year periods on both a GAAP and adjusted basis due to continued investment in the global commercial launch of BRUKINSA primarily in the U.S. and Europe. SG&A expenses as a percentage of product sales were 45% and 48% for the fourth quarter and full year 2024, respectively, compared to 66% and 69% in the prior-year periods.


Net Loss


GAAP net loss improved for the fourth quarter and full year 2024, as compared to the prior-year periods, primarily attributable to reduced operating losses.


For the fourth quarter of 2024, net loss per share was $0.11 per share and $1.43 per American Depositary Share (ADS), compared to $0.27 per share and $3.53 per ADS in the prior-year period. Net loss for full year 2024 was $0.47 per share and $6.12 per ADS, compared to $0.65 per share and $8.45 per ADS in the prior-year period.


Cash Provided by Operations for the fourth quarter 2024 was $75 million, an increase of $297 million over the prior-year period. For full year 2024, cash used in operations was $141 million, a decrease of $1.0 billion from the prior-year period. The improvement in operating cash flows in the period was primarily driven by improved GAAP operating loss and non-GAAP operating income.


For further details on BeiGene’s 2024 Financial Statements, please see BeiGene’s Annual Report on Form 10-K for fiscal year 2024 filed with the U.S. Securities and Exchange Commission.


Full Year 2025 Guidance


BeiGene’s financial guidance is summarized below:


FY 20251


Total Revenue


$4.9 billion to $5.3 billion


GAAP Operating Expenses (R&D and SG&A)


$4.1 billion to $4.4 billion


Additional:


GAAP Gross Margin Percentage in mid-80% range


Positive Full Year GAAP Operating Income


Generation of Positive Cash Flow from Operations


1 Does not assume any potential new, material business development activity or unusual/non-recurring items. Assumes January 31, 2025 foreign exchange rates.


BeiGene’s total revenue guidance for full year 2025 of $4.9 billion to $5.3 billion includes expectations for strong revenue growth driven by BRUKINSA’s U.S. leadership position and continued global expansion in both Europe and other important rest of world markets. Gross margin percentage is expected to be in the mid-80% range due to mix and production efficiencies as compared to 2024. BeiGene’s guidance for combined operating expenses on a GAAP basis includes expectations of investment to support growth in both commercial and research at a pace that continues to deliver meaningful operating leverage. Non-GAAP operating expenses, which exclude costs related to share-based compensation, depreciation and amortization expense, are expected to track with GAAP operating expenses, with reconciling items unchanged from existing practice. Operating expense guidance does not assume any potential new, material business development activity or unusual/non-recurring items.


Conference Call and Webcast


The Company’s earnings conference call for the fourth quarter and full year 2024 will be broadcast via webcast at 8:00 a.m. ET on Thursday, February 27, 2025, and will be accessible through the Investors section of BeiGene’s website, www.beigene.com. Supplemental information in the form of a slide presentation and a replay of the webcast will also be available.


About BeiGene


BeiGene, which plans to change its name to BeOne Medicines Ltd., is a global oncology company that is discovering and developing innovative treatments that are more affordable and accessible to cancer patients worldwide. With a broad portfolio, we are expediting development of our diverse pipeline of novel therapeutics through our internal capabilities and collaborations. We are committed to radically improving access to medicines for far more patients who need them. Our growing global team of more than 11,000 colleagues spans six continents. To learn more about BeiGene, please visit www.beigene.com and follow us on LinkedIn, X (formerly known as Twitter), Facebook and Instagram.


BeiGene intends to use the Investors section of its website, its X (formerly known as Twitter) account at x.com/BeiGeneGlobal, its LinkedIn account at linkedin.com/company/BeiGene, its Facebook account at facebook.com/BeiGeneGlobal, and its Instagram account at instagram.com/BeiGeneGlobal to disclose material information and to comply with its disclosure obligations under Regulation FD. Accordingly, investors should monitor BeiGene’s website, its X account, its LinkedIn account, its Facebook account, and its Instagram account in addition to BeiGene’s press releases, SEC filings, public conference calls, presentations, and webcasts.


Forward-Looking Statements


This press release contains forward-looking statements within the meaning of the Private Securities Litigation Reform Act of 1995 and other federal securities laws, including statements regarding timing of proof-of-concept data readouts, clinical trial activities and readouts, study enrollment, and regulatory approvals; BeiGene’s future revenue, operating income, cash flow, operating expenses and gross margin percentage; the future of BeiGene’s solid tumor pipeline and its ability to address unmet patient need across multiple disease areas and therapeutic modalities; the future success of BeiGene’s clinical trials and new molecular entities; and BeiGene’s plans, commitments, aspirations and goals under the caption “About BeiGene”. Actual results may differ materially from those indicated in the forward-looking statements as a result of various important factors, including BeiGene’s ability to demonstrate the efficacy and safety of its drug candidates; the clinical results for its drug candidates, which may not support further development or marketing approval; actions of regulatory agencies, which may affect the initiation, timing and progress of clinical trials and marketing approval; BeiGene’s ability to achieve commercial success for its marketed medicines and drug candidates, if approved; BeiGene’s ability to obtain and maintain protection of intellectual property for its medicines and technology; BeiGene’s reliance on third parties to conduct drug development, manufacturing, commercialization, and other services; BeiGene’s limited experience in obtaining regulatory approvals and commercializing pharmaceutical products; BeiGene’s ability to obtain additional funding for operations and to complete the development of its drug candidates and achieve and maintain profitability; and those risks more fully discussed in the section entitled “Risk Factors” in BeiGene’s most recent annual report on Form 10-K, as well as discussions of potential risks, uncertainties, and other important factors in BeiGene’s subsequent filings with the U.S. Securities and Exchange Commission. All information in this press release is as of the date of this press release, and BeiGene undertakes no duty to update such information unless required by law. BeiGene’s financial guidance is based on estimates and assumptions that are subject to significant uncertainties.


Condensed Consolidated Statements of Operations (U.S. GAAP)


(Amounts in thousands of U.S. dollars, except for shares, American Depositary Shares (ADSs), per share and per ADS data)


Fourth Quarter


Full Year


2024


2023


2024


2023


(unaudited)


(audited)


Revenue


Product revenue, net


$1,118,035


$630,526


$3,779,546


$2,189,852


Collaboration revenue


9,789


3,883


30,695


268,927


Total revenues


1,127,824


634,409


3,810,241


2,458,779


Cost of sales - products


160,560


105,832


594,089


379,920


Gross profit


967,264


528,577


3,216,152


2,078,859


Operating expenses


Research and development


542,012


493,987


1,953,295


1,778,594


Selling, general and administrative


504,677


418,385


1,831,056


1,508,001


Total operating expenses


1,046,689


912,372


3,784,351


3,286,595


Loss from operations


(79,425)


(383,795)


(568,199)


(1,207,736)


Interest income , net


7,808


16,274


47,836


74,009


Other (expense) income, net


(13,734)


16,749


(12,638)


307,891


Loss before income taxes


(85,351)


(350,772)


(533,001)


(825,836)


Income tax expense


66,530


16,781


111,785


55,872


Net loss


(151,881)


(367,553)


(644,786)


(881,708)


Net loss per share


$(0.11)


$(0.27)


$(0.47)


$(0.65)


Weighted-average shares outstanding—basic and diluted


1,381,378,234


1,353,005,058


1,368,746,793


1,357,034,547


Net loss per American Depositary Share (“ADS”)


$(1.43)


$(3.53)


$(6.12)


$(8.45)


Weighted-average ADSs outstanding—basic and diluted


106,259,864


104,077,312


105,288,215


104,387,273


Select Condensed Consolidated Balance Sheet Data (U.S. GAAP)


(Amounts in thousands of U.S. Dollars)


As of


December 31,


December 31,


2024


2023


(audited)


Assets:


Cash, cash equivalents and restricted cash


$2,638,747


$3,185,984


Accounts receivable, net


676,278


358,027


Inventories, net


494,986


416,122


Property, plant and equipment, net


1,578,423


1,324,154


Total assets


$5,920,910


$5,805,275


Liabilities and equity:


Accounts payable


$404,997


$315,111


Accrued expenses and other payables


803,713


693,731


R&D cost share liability


165,440


238,666


Debt


1,018,013


885,984


Total liabilities


2,588,688


2,267,948


Total equity


$3,332,222


$3,537,327


Select Unaudited Condensed Consolidated Statements of Cash Flows (U.S. GAAP)


(Amounts in thousands of U.S. Dollars)


Fourth Quarter


Full Year


2024


2023


2024


2023


(unaudited)


(audited)


Cash, cash equivalents and restricted cash at beginning of period


$


2,713,428


$


3,080,892


$


3,185,984


$


3,875,037


Net cash provided by (used in) operating activities


75,160


(221,638


)


(140,631


)


(1,157,453


)


Net cash (used in) provided by investing activities


(93,605


)


(62,584


)


(548,350


)


60,004


Net cash (used in) provided by financing activities


(4,523


)


347,048


193,449


416,478


Net effect of foreign exchange rate changes


(51,713


)


42,266


(51,705


)


(8,082


)


Net (decrease) increase in cash, cash equivalents and restricted cash


(74,681


)


105,092


(547,237


)


(689,053


)


Cash, cash equivalents and restricted cash at end of period


$


2,638,747


$


3,185,984


$


2,638,747


$


3,185,984


Note Regarding Use of Non-GAAP Financial Measures


BeiGene provides certain non-GAAP financial measures, including Adjusted Operating Expenses and Adjusted Operating Loss and certain other non-GAAP income statement line items, each of which include adjustments to GAAP figures. These non-GAAP financial measures are intended to provide additional information on BeiGene’s operating performance. Adjustments to BeiGene’s GAAP figures exclude, as applicable, non-cash items such as share-based compensation, depreciation and amortization. Certain other special items or substantive events may also be included in the non-GAAP adjustments periodically when their magnitude is significant within the periods incurred. BeiGene maintains an established non-GAAP policy that guides the determination of what costs will be excluded in non-GAAP financial measures and the related protocols, controls and approval with respect to the use of such measures. BeiGene believes that these non-GAAP financial measures, when considered together with the GAAP figures, can enhance an overall understanding of BeiGene’s operating performance. The non-GAAP financial measures are included with the intent of providing investors with a more complete understanding of the Company’s historical and expected financial results and trends and to facilitate comparisons between periods and with respect to projected information. In addition, these non-GAAP financial measures are among the indicators BeiGene’s management uses for planning and forecasting purposes and measuring the Company’s performance. These non-GAAP financial measures should be considered in addition to, and not as a substitute for, or superior to, financial measures calculated in accordance with GAAP. The non-GAAP financial measures used by the Company may be calculated differently from, and therefore may not be comparable to, non-GAAP financial measures used by other companies.


RECONCILIATION OF SELECTED GAAP MEASURES TO NON-GAAP MEASURES


(Amounts in thousands of U.S. Dollars)


(unaudited)


Fourth Quarter


Full Year


2024


2023


2024


2023


Reconciliation of GAAP to adjusted cost of sales - products:


GAAP cost of sales - products


$160,560


$105,832


$594,089


$379,920


Less: Depreciation


18,089


1,898


42,707


8,578


Less: Amortization of intangibles


1,183


1,119


4,729


3,739


Adjusted cost of sales - products


$141,288


$102,815


$546,653


$367,603


Reconciliation of GAAP to adjusted research and development:


GAAP research and development


$542,012


$493,987


$1,953,295


$1,778,594


Less: Share-based compensation expenses


44,992


39,424


186,113


163,550


Less: Depreciation


22,146


17,180


98,814


56,084


Adjusted research and development


$474,874


$437,383


$1,668,368


$1,558,960


Reconciliation of GAAP to adjusted selling, general and administrative:


GAAP selling, general and administrative


$504,677


$418,385


$1,831,056


$1,508,001


Less: Share-based compensation expenses


62,790


53,328


255,680


204,038


Less: Depreciation


8,811


1,784


25,417


15,774


Less: Amortization of intangibles


17


1,838


95


3,500


Adjusted selling, general and administrative


$433,059


$361,435


$1,549,864


$1,284,689


Reconciliation of GAAP to adjusted operating expenses


GAAP operating expenses


1,046,689


912,372


3,784,351


3,286,595


Less: Share-based compensation expenses


107,782


92,752


441,793


367,588


Less: Depreciation


30,957


18,964


124,231


71,858


Less: Amortization of intangibles


17


1,838


95


3,500


Adjusted operating expenses


$907,933


$798,818


$3,218,232


$2,843,649


Reconciliation of GAAP to adjusted loss from operations:


GAAP loss from operations


$(79,425)


$(383,795)


$(568,199)


$(1,207,736)


Plus: Share-based compensation expenses


107,782


92,752


441,793


367,588


Plus: Depreciation


49,046


20,862


166,938


80,436


Plus: Amortization of intangibles


1,200


2,957


4,824


7,239


Adjusted income (loss) from operations


$78,603


$(267,224)


$45,356


$(752,473)


View source version on businesswire.com: https://www.businesswire.com/news/home/20250227911272/en/


Permalink

https://www.aetoswire.com/en/news/2702202545067


Contacts

Investor Contact

Liza Heapes

+1 857-302-5663

ir@beigene.com


Media Contact

Kyle Blankenship

+1 667-351-5176

media@beigene.com

Tecnotree Reports Consistent Revenue, Margin Expansion and Three Consecutive Quarters Of Positive Free Cashflow

 ESPOO, Finland - Wednesday, 26. February 2025 AETOSWire Print 


(BUSINESS WIRE) -- Tecnotree, a global digital platform and services leader for AI, 5G, and cloud-native technologies, today announced its financial results for the fourth quarter and full year of 2024. 2024 was a pivotal year for Tecnotree despite macro economic challenges, the company delivered 3 consecutive quarters of positive free cash flow achieving and strong ARR growth by 8% YoY from 2023. Further the company delivered on the guidance previously announced achieving a revenue increase of 4% YoY in constant currency, an increase of EBIT of 9% YoY in constant currency and an increase in Free Cash Flow by 7.9 Million Euro in 2024 from the previous period. In 2024, the company’s strategic cost optimization achieved higher savings than previously committed. Tecnotree had taken precautionary measures and made adequate provisions to exit markets which are characterised with geo-political risks, areas of conflict or regions with high risks of sanctions. Further, Tecnotree achieved a breakthrough Tier 1 telco deal in the United States, in collaboration with a leading Systems Integrator (SI) as previously announced, validating our investment in TM Forum Standards and our ability to secure recurring revenue streams in Dollar denominated enterprise markets, paving the way for sustainable growth in the future.


Q4 Results


Net sales of EUR 17.6 million (22.2) -20.7% Year on Year, In constant currency,

-16.5% Year on Year.


Operating profit of EUR 10.9 million (7.9) +38.1% Year on Year.


Operating margin of 61.7% (35.4%).


Foreign exchange losses reduced EUR 0.3 million (6.0).


Net income for the quarter was EUR 0.5 million (2.4) -79% Year on Year.


Adjusted net income for quarter EUR 4.9 million (2.4) +104% Year on Year.


Gross cash inflow from operating activities EUR 8.4 million (9.9).


Positive free cash flow of EUR 0.4 million (-0.6), the third quarter in a row.


Earnings per share EUR 0.03 (0.01*).


Order book at the end of the period EUR 79.6 million (80.2).


Full year Results


Net sales of EUR 71.6 million (78.4) –8.6% Year on Year, in constant currency +4.0% Year on Year, in line with guidance.


Operating profit EUR 23.8 million (23.8) flat Year on Year, however operating profit margin expanded to 33.2% (30.4%). Operating profit in constant currency EUR 26.0 million, +9.0 % Year on Year in line with guidance.


Foreign exchange losses reduced to EUR 2.5 million (9.7).


Net Income for the period EUR 8.3 million (11.2) -25.8% Year on Year due to one-time items pertaining to EUR 7.3 million.


Adjusted net income was EUR 15.6 million (11.2) +39.3% Year on Year.


Gross cash inflow from operating activities EUR 21.3 million (17.4).


Free cash flow stands at EUR -1.8 million ( -9.7).


Free cash flow for H2 stands at EUR 2.2 million (-3.9) in line with guidance.


Earnings per share were EUR 0.5 (0.04*).


"Tecnotree’s SISU-driven execution has delivered a pivotal year of transformation, resilience, and growth. With three consecutive quarters of positive free cash flow, a landmark Tier 1 telco deal in the U.S., and a strengthened focus on AI-powered automation, we have reinforced our financial position and market leadership. Our cost optimization initiatives exceeded expectations, while our ARR expansion and strategic shift to Tier 1 and dollar-denominated markets ensure a scalable and profitable future. As we step into 2025, we remain committed to driving AI-led innovation, sustainable growth, and delivering long-term value to our investors and customers."


– Padma Ravichander, CEO, Tecnotree


Significant milestones and business achievements for the year included:


Tecnotree Increased productivity from AI/ML consistently executing 5-7 digital transformations per quarter, reinforcing our ability to scale revenue with efficiency.


2024 Gartner® Magic Quadrant for AI in CSPs – A first-time recognition for our AI-driven telco transformations.


Among the Top 2 Global Telecom Revenue Management Providers (Precision Reports, for the 2nd consecutive year.


Featured in 4 Gartner® HypeCycles & 2 Gartner® Market Guides for CSP digital marketplaces, revenue management, and Customer Management solutions.


Named one of the fastest-growing BSS providers by Omdia in 2024, highlighting our momentum against legacy competitors.


In 2024 Tecnotree for the second consecutive year was recognized as a top-performing company in the Nordic Business Diversity Index (Mid-Cap Segment), reinforcing our commitment to building inclusive, digitally connected communities while delivering strong financial outcomes.


About Tecnotree


Tecnotree is a 5G-ready digital Business Support System (BSS) player, with AI/ML capabilities and multi-cloud extensibility. Tecnotree leads the way on the TM Forum Open API Conformance with 59 certified Open APIs including 9 real-world open APIs, a testament to the company's commitment to excellence, and continuously striving to deliver differentiated experiences and services to both CSPs and DSPs. Our agile and open-source digital BSS Stack comprises the full range (order-to-cash) of business processes and subscription management for telecom and other digital services industries creating opportunities beyond connectivity. Tecnotree also provides Fintech and B2B2X multi-experience digital marketplace to its subscriber base through the Tecnotree Moments platform to empower digitally connected communities across gaming, health, education, OTT, and other vertical ecosystems. Tecnotree is listed on the Helsinki Nasdaq (TEM1V).


View source version on businesswire.com: https://www.businesswire.com/news/home/20250226249918/en/


Permalink

https://www.aetoswire.com/en/news/2602202545021


Contacts

Prianca Ravichander, Tecnotree CMO

Email: marketing@tecnotree.com

Andersen Global Advances Valuation Capabilities in Ethiopia with New Collaborating Firm

 SAN FRANCISCO - Thursday, 27. February 2025 AETOSWire 


(BUSINESS WIRE)--Andersen Global extends its African footprint with collaborating firm ADS Valuation Services PLC, enhancing its valuation capabilities and solidifying its platform in Ethiopia.


Headquartered in Addis Ababa, ADS Valuation Services PLC provides valuation and advisory services to businesses and investors. The firm offers a comprehensive range of valuation services, including fixed and movable assets, intangible assets, and business valuations.


“Our team is committed to serving businesses and investors by delivering tailored solutions and leveraging our industry expertise,” said General Manager Adnan Esmael. “Ethiopia’s rapidly evolving business landscape, highlighted by the recent launch of the country’s first securities exchange and various policy changes attracting foreign investment, presents unique opportunities for growth. Through our collaboration with Andersen Global, we reinforce our commitment to client service and remain well-positioned to help clients navigate the dynamic market conditions both locally and globally.”


Global Chairman and CEO of Andersen Mark L. Vorsatz added, “There is a clear and growing demand for valuation services in Ethiopia, including securities and business valuations. The ADS team has a strong relationship with our existing tax team in the country, and their deep expertise enhances our ability to meet the evolving needs of clients while building on our continued growth in the valuation sector and reinforcing our role as a leading organization across the African continent.”


Andersen Global is an international association of legally separate, independent member firms comprised of tax, legal, and valuation professionals around the world. Established in 2013 by U.S. member firm Andersen Tax LLC, Andersen Global now has more than 19,000 professionals worldwide and a presence in over 500 locations through its member firms and collaborating firms.


View source version on businesswire.com: https://www.businesswire.com/news/home/20250227727297/en/


Permalink

https://www.aetoswire.com/en/news/2702202545075


Contacts

Megan Tsuei

Andersen Global

415-764-2700

Hai Robotics Unveils HaiPick Climb: Revolutionizing Warehouse Automation With Simplified Efficiency

ATLANTA - Wednesday, 26. February 2025


Simplified goods-to-person system redefines efficiency, density, scalability, and reliability for warehouses of all conditions


(BUSINESS WIRE) -- Hai Robotics, a global leader in warehouse automation, today announced the release of HaiPick Climb, a revolutionary robotic solution that simplifies goods-to-person automation, enabling warehouses and distribution centers to retrofit existing facilities more easily. It increases throughput while reducing implementation time and costs compared to traditional Automated Storage and Retrieval Systems (ASRS), making ASRS more accessible and affordable for a wider range of facilities.


Built around the innovative HaiClimber robot, an intelligent, compact climbing robot, HaiPick Climb unlocks new possibilities in warehouse automation. This breakthrough system offers a smarter, simplified way for warehouses and distribution centers to boost efficiency, increase storage density, and scale operations — all with minimal infrastructure requirements.


“We know that many warehouses want to automate but are put off by the complexity and cost,” said Richie Chen, Founder and CEO of Hai Robotics. “That’s why we created HaiPick Climb — to deliver powerful automation without the need for major facility modifications. Our system is built on simplicity, requiring only standard racking and minimal floor preparation while providing top-tier performance.”


A Simpler Way to Automate


The HaiPick Climb system is designed for easy installation, operation, and ownership, with seamless expansion and system modifications — all while advancing the benefits of traditional ASRS.


Hai Robotics' goods-to-person solutions are widely recognized for their ability to automate storage and retrieval for a range of tailored needs. HaiPick Climb now offers a more standardized solution that makes automation more accessible to more facilities.


Easy to Implement and Scale


HaiPick Climb operates by attaching climbing channels to one side of nearly any industry-standard racking. Compact robots travel up and down these channels, retrieving totes from both sides of narrow aisles. Since the system mounts from just one side, it requires less infrastructure and is more tolerant of floor irregularities than typical ASRS, reducing facility preparation and cutting implementation costs.


The system is easily expandable with minimal disruption, enabling phased implementations and modifications without interrupting operations.


Easy to Operate and Maintain


Human travel for order picking is eliminated with the HaiPick Climb system. Totes of goods are automatically delivered to one or more ergonomic workstations that are easy to use and quick to learn. An easy-to-understand interface makes picking fast and efficient with a 99%+ accuracy rate.


The HaiClimber robots are easy to maneuver and maintain. Their mechanics are easy to access, with half the climbing mechanisms of typical climbing robots, simplifying maintenance. Aisles allow just enough space for standard compact scissor lift access, eliminating the need for specialized equipment to access the system’s interior, while the use of industry-standard racking makes maintenance a breeze.


Extreme Throughput Efficiency


HaiClimbers freely navigate under racking, allowing for the most direct and optimized path for each tote delivery and avoiding robot congestion that can occur in aisle "highways." Robots have direct access to every tote at all times, eliminating the wasted response time associated with searching or digging.


Traveling an extreme speed of 4 meters per second (13 feet per second) and climbing at 1 meter per second (3 feet per second), the HaiPick Climb system can process 4,000 totes per hour within a 1,000-square-meter (10,764-square-foot) space. Totes are delivered to workstations in as little as 2 minutes after order receipt — 34% faster than traditional ASRS — allowing for extended order cutoff times for same-day fulfillment.


Maximum Storage Density


Facilities can achieve 30,000 storage locations within a 1,000-square-meter (10,764-square-foot) space, with totes stored up to 12 meters (39+ feet) high. This is over 6 times higher than manual storage operations and provides 35% more vertical storage capacity than other leading ASRS solutions.


Narrow aisle widths, minimized to 900 millimeters (35.5 inches), further optimize space utilization. This combination of high storage density and vertical access enables facilities to reduce their storage footprint by up to 75%.


“This isn’t just automation — it’s empowerment,” Chen said. “HaiPick Climb allows businesses to achieve new levels of efficiency and scalability without the typical barriers of ASRS. It’s about making advanced automation available to everyone.”


About Hai Robotics


Founded in 2016, Hai Robotics is a leading global provider of Automated Storage and Retrieval Systems (ASRS), delivering unparalleled system flexibility and maximizing operational efficiency for facilities of all sizes and conditions.


Hai developed a modular approach to automation called HaiPick Systems. With a catalog of advanced robotic equipment and software that operates with nearly any industry-standard racking and storage materials, Hai Robotics provides tailored automation solutions that can be easily modified even after implementation.


HaiPick Systems reduce warehouse storage footprints by up to 75% through increased storage density, with vertical storage reaching up to 12 meters (39+ feet). They achieve 99%+ order pick accuracy, 4x increased efficiency, 3x daily throughput, and eliminate human travel for order picking.


With 1,500+ projects implemented across 40+ countries, supported by 8 global offices and 60+ partners worldwide, Hai Robotics is a reliable resource for providing local support.


Visit HaiRobotics.com for more information.


View source version on businesswire.com: https://www.businesswire.com/news/home/20250225781910/en/


Permalink

https://www.aetoswire.com/en/news/2602202545020


Contacts

Global PR Manager

pr@hairobotics.com


AB InBev Reports Full Year and Fourth Quarter 2024 Results


 Continued global momentum delivered all-time high revenue and 15% Underlying EPS growth in FY24


(BUSINESS WIRE)--Anheuser-Busch InBev (Brussel:ABI) (BMV:ANB) (JSE:ANH) (NYSE:BUD):

Regulated and inside information1

“Beer is a passion point for consumers and a vibrant category globally. The strength of our 2024 results is a testament to the consistent execution of our strategy and the hard work and dedication of our people. We delivered EBITDA growth at the top-end of our outlook and a step change in our free cash flow generation. We are investing for the long-term and are confident in our ability to lead and grow the category.” – Michel Doukeris, CEO, AB InBev

Total Revenue

4Q +3.4% | FY +2.7%

Revenue increased by 3.4% in 4Q24 with revenue per hl growth of 5.5% and by 2.7% in FY24 with revenue per hl growth of 4.3%. Reported revenue increased by 2.5% in 4Q24 and by 0.7% in FY24 to 14 841 million USD and 59 768 million USD respectively, impacted by unfavorable currency translation.


Total Volume

4Q -1.9% | FY -1.4%

In 4Q24, total volumes declined by 1.9%, with own beer volumes down by 2.1% and non-beer volumes down by 1.1%. 

In FY24, total volumes declined by 1.4% with own beer volumes down by 2.0% and non-beer volumes up by 1.5%.


Normalized EBITDA

4Q +10.1% | FY +8.2%

In 4Q24, normalized EBITDA increased by 10.1% to 5 245 million USD with a normalized EBITDA margin expansion of 216bps to 35.3%. 

In FY24, normalized EBITDA increased by 8.2% to 20 958 million USD with a normalized EBITDA margin expansion of 179bps to 35.1%.


Underlying Profit (million USD)

4Q 1 770 | FY 7 061

Underlying Profit (Profit attributable to equity holders of AB InBev excluding non-underlying items and the impact of hyperinflation) was 1 770 million USD in 4Q24 compared to 1 661 million USD in 4Q23 and was 7 061 million USD in FY24 compared to 6 158 million USD in FY23. Reported profit attributable to equity holders of AB InBev was 1 220 million USD in 4Q24 and 5 855 million USD in FY24 versus 1 891 million USD in 4Q23 and 5 341 million USD in FY23, negatively impacted by non-underlying items.


Underlying EPS (USD)

4Q 0.88 | FY 3.53

Underlying EPS was 0.88 USD in 4Q24, an increase from 0.82 USD in 4Q23 and was 3.53 USD in FY24, an increase from 3.05 USD in FY23.


Net Debt to EBITDA

2.89x

Net debt to normalized EBITDA ratio was 2.89x at 31 December 2024, compared to 3.38x at 31 December 2023.

Capital Allocation

Dividend 1.00 EUR

The AB InBev Board proposes a full year 2024 dividend of 1.00 EUR per share, subject to shareholder approval at the AGM on 30 April 2025. A timeline showing the ex-dividend, record and payment dates can be found on page 16. 

Out of the two billion USD share buyback program announced on 31 October 2024, approximately 750 million USD was completed as of 21 February 2025.

The 2024 Full Year Financial Report is available on our website at www.ab-inbev.com

1The enclosed information constitutes inside information as defined in Regulation (EU) No 596/2014 of the European Parliament and of the Council of 16 April 2014 on market abuse, and regulated information as defined in the Belgian Royal Decree of 14 November 2007 regarding the duties of issuers of financial instruments which have been admitted for trading on a regulated market. For important disclaimers and notes on the basis of preparation, please refer to page 17.

Management comments

Consistent execution of our strategy

We made consistent progress across the 3 pillars of our strategy in 2024 and delivered another year of reliable compounding growth. The combination of our megabrands, mega platforms and our focus on innovation to meet consumer trends with both balanced choices and superior value is a winning proposition. While our overall volume performance this year was constrained by the soft consumer environments in China and Argentina, the global beer category remains vibrant with our volumes growing in the majority of our markets and by 0.9% overall when excluding these two countries.

We advanced our digital transformation, with 75% of our revenue now transacted through B2B digital platforms. The momentum of BEES marketplace accelerated, with the gross merchandise value (GMV) growing by 57% versus FY23 to reach 2.5 billion USD.

As we continue to optimize our business we delivered a high-quality set of financial results. USD revenues increased to an all-time high, EBITDA grew at the top-end of our outlook, Underlying EPS increased by 15.4% in USD and free cash flow generation increased by 2.5 billion USD. We enhanced the efficiency of our resource allocation and delivered an important milestone in our capital allocation journey with our net debt to EBITDA ratio reaching 2.89x as of 31 December 2024, below 3x for the first time since 2015.

The beer category is large and profitable, continues to gain share of alcohol globally and our footprint has structural tailwinds for long-term volume growth with favorable demographics, economic growth and opportunities to increase category participation.

Continued global momentum

Our top-line increased by 2.7% in FY24, with revenue growth in 75% of our markets. Revenue per hl increased by 4.3%, accelerating sequentially through the year, as we continued to make disciplined revenue management choices and drive premiumization, while investing in our brands to provide value to our consumers. Excluding China and Argentina our volumes globally grew by 0.9% but overall performance was significantly constrained by these two countries, resulting in a total volume decline of 1.4%.

EBITDA increased by 8.2% with production cost efficiencies and disciplined overhead management driving EBITDA margin expansion of 179bps. Underlying EPS was 3.53 USD, a 15.4% increase versus FY23, driven primarily by USD EBIT growth and optimization of our net finance costs.

Progressing our strategic priorities

  • Lead and grow the category

    In FY24, we invested 7.2 billion USD in sales and marketing behind our megabrands, mega platforms and brand building capabilities to lead the long-term growth of the global beer category. The beer and Beyond Beer category continued to gain share of total alcohol globally with further growth projected over the next 5 years, according to IWSR. We estimate that we gained or maintained share in two thirds of our markets, with our megabrands, which represent 57% of our revenue, leading our growth with a 4.6% revenue increase.

    Our unparalleled portfolio holds 20 iconic billion-dollar revenue beer brands and 8 out of the top 10 most valuable beer brands in the world, with Corona and Budweiser the #1 and #2, according to Kantar BrandZ. We successfully activated our portfolio in some of the largest consumer moments such as the Olympics, NBA, Copa America, Lollapalooza, Wimbledon and the Super Bowl, driving an increase in our overall portfolio brand power.

    Our marketing effectiveness and creativity was recognized by again being named the most effective marketer in the world by both Effies and the World Advertising Research Center and being the most awarded beverage company at the 2024 Cannes Lions International Festival of Creativity.
     
    • Category Participation: Investments in our megabrands and innovations drove an estimated increase in the percentage of beer consumers purchasing our portfolio globally of approximately 90 basis points. Participation increases were driven by improvements with all consumer groups in the US and with new legal drinking age consumers (LDA-24 years old) in 65% of our markets.
    • Core Superiority: Our mainstream beer portfolio represented approximately 50% of our FY24 revenue and delivered low-single digit revenue growth, with increases in 60% of our markets, including high-single digit growth in South Africa and Colombia.
    • Occasions Development: We continue to focus on innovating to expand occasions and meet consumer trends. Our portfolio includes options for consumers seeking balanced choices such as low carb, organic, sugar free, gluten free and no-alcohol brands. In no-alcohol beer, our portfolio delivered a low-twenties revenue increase in FY24 and is estimated to have gained share globally, led by Corona Cero which delivered triple-digit volume growth. We are the leader in no-alcohol beer in many of our key markets, including the US, Brazil and Belgium, and see significant headroom for future growth.
    • Premiumization: We are the global leader in premium and super premium beer. Our above core beer portfolio represented 35% of our FY24 revenue and grew revenue by low-single digits. Corona led our performance, increasing revenue by low-teens outside of Mexico with double-digit volume growth in more than 30 markets. In the US, Michelob Ultra led our growth and was the #1 volume share gaining brand in the industry in 2H24. In Brazil, Budweiser was the #1 volume share gaining brand in the industry with volumes increasing by nearly 50%.
    • Beyond Beer: In FY24, our Beyond Beer business represented 2% of our revenue and grew revenue by low-single digits led by double-digit growth in key brands such as Cutwater, Nütrl and Brutal Fruit.
  • Digitize and monetize our ecosystem

    We continued to progress our digital transformation by expanding the availability and usage of BEES, accelerating the growth of BEES Marketplace and scaling our digital DTC megabrands.
     
    • Digitizing our relationships with our more than six million customers globally: As of 31 December 2024, BEES was live in 28 markets, with 75% of our revenues captured through B2B digital platforms. In FY24, BEES captured 49 billion USD in GMV, growth of 19% versus FY23.
    • Monetizing our route-to-market: BEES Marketplace generated 36 million orders and captured 2.5 billion USD in GMV from sales of third-party products this year, growth of 31% and 57% versus FY23 respectively.
    • Leading the way in DTC solutions: Our omnichannel DTC ecosystem of digital and physical products generated revenue of 1.4 billion USD this year. Our DTC megabrands, Zé Delivery, TaDa Delivery and PerfectDraft are available in 21 markets, generated over 76 million e-commerce orders and delivered 560 million USD of revenue in FY24, growth of 9% versus FY23.
  • Optimize our business
     
    • Maximizing value creation: We enhanced our resource allocation efficiency this year, optimizing our net capex from 4.5 billion USD in FY23 to 3.7 billion USD in FY24 while continuing to invest in our facilities, digital transformation and growth priorities. Increased capex efficiency, USD EBITDA growth and the optimization of our net working capital and finance costs drove strong growth in our free cash flow generation, reaching 11.3 billion USD in FY24, a 2.5 billion USD increase versus FY23.

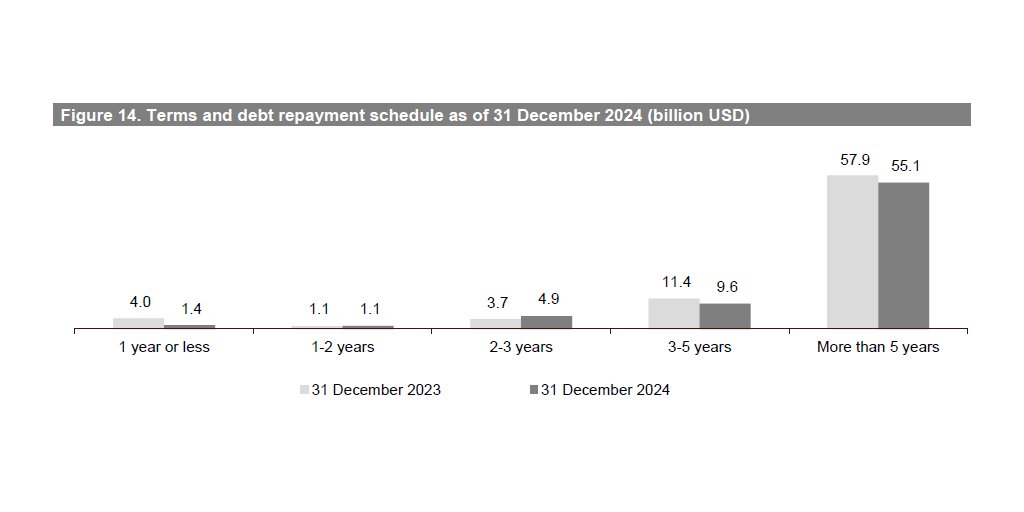
      We continued to proactively manage our debt portfolio in FY24 with bond repurchases of 9 billion USD and issuances of 5 billion USD strengthening our debt maturity profile while maintaining our average coupon. We reduced net debt by 6.9 billion USD to reach 60.6 billion USD, resulting in a net debt to EBITDA ratio of 2.89x as of 31 December 2024, below 3.0x for the first time since 2015.

      The AB InBev Board of Directors has proposed a full year dividend of 1.00 EUR per share, a 22% increase versus FY23, with the ambition to continue a progressive dividend over time. In addition, as of 21 February 2025 we have completed 750 million USD of our 2 billion USD share buyback program announced on 31 October 2024.
       
    • Advancing our sustainability priorities: In FY24, we contracted the equivalent of 100% of our global purchased electricity volume from renewable sources with 81.2% operational. Since 2017, we reduced our absolute GHG emissions across Scopes 1 and 2 by 42% and GHG emissions intensity across Scopes 1, 2 and 3 by 29.5%. In sustainable agriculture, 100% of our direct farmers met our criteria for skilled, connected and financially empowered. In water stewardship, 89% of sites in scope for our 2025 goal are already seeing improvement in watershed health. Our water use efficiency ratio improved to 2.47 hl per hl, an improvement of 20% versus a 2017 baseline. For circular packaging, 89.8% of our products were in packaging that was returnable or made from majority recycled content.

      We have supported responsible drinking for decades and have invested over 1 billion USD in responsibility programs across the globe since 2016. We continue to promote beer as the beverage for moderation and provide choices for consumers, including no alcohol and low alcohol beers.

      Please refer to our Sustainability Statements in our 2024 annual report here for further details, including how our metrics are calculated and the related assumptions.

Delivering reliable compounding growth

2024 also marked three years since we introduced our 3-pillar strategy and medium-term growth ambition and reoriented the business to drive long-term value creation through organic growth. While the operating environment over this time has been dynamic, we are encouraged when we look back and evaluate the resilience of our business, consistency of our performance and the progress we have made in the execution of our strategy.

Since FY21, we have increased our revenue by 5.5 billion USD, EBITDA by 1.7 billion USD and free cash flow by 2.0 billion USD. Our Underlying EPS has increased by a CAGR of 7% in USD. Our financial performance has been consistent, with organic EBITDA growth within or above our medium-term growth ambition in every quarter over the last 3 years. We have been disciplined in our capital allocation choices, reducing net debt by 15.5 billion USD to reach 2.89x net debt to EBITDA, progressively increased our dividend each year and announced 3.2 billion USD of share buybacks. We have advanced our digital transformation, with the GMV captured by BEES more than doubling from approximately 20 billion USD in FY21 to 49 billion USD in FY24, and we have built a fast-growing Marketplace of third-party products from a standing start to a 2.5 billion USD GMV business.

We are encouraged by the progress we have made over the last three years and will continue to work towards consistently compounding our growth over the long-term to unlock our full value creation potential. Our performance would not have been possible without the hard work and dedication of our people and we thank our colleagues globally for their passion and commitment.

Looking forward

Looking ahead to 2025, we are committed to investing for long-term growth. While the operating environment remains dynamic in certain markets, we are confident in our ability to deliver on our outlook and energized about the opportunities ahead to grow the category. Consumers are passionate about beer and our iconic brands. We are well-positioned to lead category growth with our industry-leading portfolio of beer, beyond beer and no-alcohol beverages, diversified geographic footprint and unique leadership advantages.

2025 Outlook

(i) Overall Performance: We expect our EBITDA to grow in line with our medium-term outlook of between 4-8%. The outlook for FY25 reflects our current assessment of inflation and other macroeconomic conditions.

(ii) Net Finance Costs: Net pension interest expenses and accretion expenses are expected to be in the range of 190 to 220 million USD per quarter, depending on currency and interest rate fluctuations. We expect the average gross debt coupon in FY25 to be approximately 4%.

(iii) Effective Tax Rates (ETR): We expect the normalized ETR in FY25 to be in the range of 26% to 28%. The ETR outlook does not consider the impact of potential future changes in legislation.

(iv) Net Capital Expenditure: We expect net capital expenditure of between 3.5 and 4.0 billion USD in FY25.

Figure 1. Consolidated performance (million USD)


4Q23


4Q24


Organic


growth

Total Volumes (thousand hls)


144 706


141 829


-1.9%

AB InBev own beer


123 764


121 059


-2.1%

Non-beer volumes


19 998


19 775


-1.1%

Third party products


944


995


7.8%

Revenue


14 473


14 841


3.4%

Gross profit


7 794


8 197


6.3%

Gross margin


53.9%


55.2%


153bps

Normalized EBITDA


4 877


5 245


10.1%

Normalized EBITDA margin


33.7%


35.3%


216bps

Normalized EBIT


3 491


3 824


12.0%

Normalized EBIT margin


24.1%


25.8%


199bps


Profit attributable to equity holders of AB InBev


1 891


1 220


Underlying profit attributable to equity holders of AB InBev


1 661


1 770


Earnings per share (USD)


0.94


0.61


Underlying earnings per share (USD)


0.82


0.88


FY23


FY24


Organic


growth

Total Volumes (thousand hls)


584 728


575 706


-1.4%

AB InBev own beer


505 899


495 496


-2.0%

Non-beer volumes


74 810


75 932


1.5%

Third party products


4 019


4 278


7.0%

Revenue


59 380


59 768


2.7%

Gross profit


31 984


33 024


5.4%

Gross margin


53.9%


55.3%


143bps

Normalized EBITDA


19 976


20 958


8.2%

Normalized EBITDA margin


33.6%


35.1%


179bps

Normalized EBIT


14 590


15 462


9.4%

Normalized EBIT margin


24.6%


25.9%


160bps


Profit attributable to equity holders of AB InBev


5 341


5 855


Underlying profit attributable to equity holders of AB InBev


6 158


7 061


Earnings per share (USD)


2.65


2.92


Underlying earnings per share (USD)


3.05


3.53


Figure 2. Volumes (thousand hls)


4Q23


Scope


Organic


4Q24


Organic growth


growth


Total


Own beer

North America


19 738


-


-223


19 516


-1.1%


-0.8%

Middle Americas


38 635


-4


276


38 907


0.7%


1.5%

South America


46 704


-


-1 753


44 950


-3.8%


-4.8%

EMEA


23 964


-


919


24 883


3.8%


2.9%

Asia Pacific


15 465


-75


-1 952


13 439


-12.7%


-12.7%

Global Export and Holding Companies


200


-24


-41


135


-23.4%


-28.0%

AB InBev Worldwide


144 706


- 103


-2 774


141 829


-1.9%


-2.1%


FY23


Scope


Organic


FY24


Organic growth


growth


Total


Own beer

North America


90 140


-470


-3 397


86 272


-3.8%


-4.1%

Middle Americas


148 730


-18


1 373


150 086


0.9%


1.4%

South America


162 460


-


-1 692


160 768


-1.0%


-2.1%

EMEA


90 213


-


3 591


93 804


4.0%


3.0%

Asia Pacific


92 726


-75


-8 255


84 397


-8.9%


-8.9%

Global Export and Holding Companies


459


-24


-56


380


-12.8%


-11.7%

AB InBev Worldwide


584 728


- 586


-8 435


575 706


-1.4%


-2.0%

Key Market Performances

United States: Increased investment driving momentum and improved market share trend, led by the #1 and #2 volume share growth brands in the industry in Q4

  • Operating performance:
    • 4Q24: Revenue increased by 0.8% with revenue per hl increasing by 2.5% driven by revenue management initiatives and premiumization. Our sales-to-retailers increased by 0.5%, estimated to have outperformed the industry. Sales-to-wholesalers (STWs) declined by 1.7%. EBITDA declined by 0.2% as productivity initiatives and SG&A efficiencies were reinvested in increased marketing investments.
    • FY24: Revenue declined by 2.0%, with revenue per hl increasing by 1.9%. Our STWs declined by 3.9%, supported by two additional selling-days in the year, and STRs were down by 5.0%. EBITDA increased by 2.2% with margin expansion of approximately 140bps.
  • Commercial highlights: The beer industry remained resilient, improving in both volume and revenue trends sequentially since 2Q24 and gaining share of total alcohol by value in FY24, according to Circana. Our beer portfolio is estimated to have gained market share in 4Q24, driven by Michelob Ultra and Busch Light which were the #1 and #2 volume share gainers in the industry respectively. The momentum of our mainstream beer portfolio improved throughout the year, gaining share of the segment in both Q3 and Q4. We are the leader in no-alcohol beer and have seen strong consumer demand for Michelob Ultra Zero post its launch in January 2025. In Beyond Beer, the spirits-based ready-to-drink category accounted for 100% of the spirits industry’s value growth in FY24 with our portfolio outperforming the industry and delivering volume growth in the mid-teens, led by Cutwater and Nütrl. We continue to invest to rebalance our portfolio towards growing segments with our above core portfolio of beer and Beyond Beer brands representing approximately 45% of our revenue.

Mexico: Record high volumes with market share gain and margin expansion

  • Operating performance:
    • 4Q24: Revenue grew by high-single digits, with mid-single digit revenue per hl growth driven by revenue management initiatives. Volumes grew by low-single digits, in-line with the industry, which returned to growth in an improved consumer environment. EBITDA grew by mid-teens with margin expansion.
    • FY24: Revenue grew by mid-single digits with revenue per hl growth of low-single digits. Volumes increased by low-single digits, outperforming the industry. EBITDA grew by high-single digits with margin expansion.
  • Commercial highlights: The momentum of our business continued in FY24, with our portfolio delivering record high volumes and continuing to gain share of the industry. Our performance was led by our core beer portfolio, which grew revenue by mid-single digits driven by Corona, while our above core beer brands continued to grow, delivering low-single digit revenue growth. We are leading the growth in no-alcohol beer with Corona Cero growing volume by strong double-digits. We continued to progress our digital initiatives, with BEES Marketplace growing GMV by 24% versus FY23 and our digital DTC platform, TaDa Delivery, increasing the number of orders by 21%.

Colombia: Record high volumes delivered double-digit top- and bottom-line growth

  • Operating performance:
    • 4Q24: Revenue increased by high-single digits with mid-single digit revenue per hl growth, driven by revenue management initiatives. Volumes grew by low-single digits. EBITDA grew by mid-teens with margin expansion.
    • FY24: Revenue grew by low-teens with high-single digit revenue per hl growth. Volumes increased by low-single digits. EBITDA grew by high-teens with margin expansion.
  • Commercial highlights: Driven by the consistent execution of our category expansion levers, the beer category continues to grow, with our portfolio gaining 85 bps share of total alcohol this year and with our volumes reaching a new record high. Our performance was driven by our above core beer brands which delivered high-single digit volume growth, led by Corona and Stella Artois. Our mainstream beer portfolio continued to grow, delivering a low-single digit volume increase.

Brazil: Market share gain and margin expansion drove double-digit bottom-line growth

  • Operating performance:
    • 4Q24: Revenue grew by 0.9% with revenue per hl growth of 3.8% driven by premiumization and revenue management initiatives. Total volumes declined by 2.8%, with beer volumes declining by 3.9%, estimated to have outperformed the industry which was impacted by adverse weather. Non-beer volumes were flat. EBITDA increased by 8.0% with margin expansion of 237bps.
    • FY24: Revenue grew by 4.7% with a revenue per hl increase of 3.1%. Total volumes grew by 1.5% with beer volumes up by 0.6%, estimated to have outperformed the industry, and non-beer volumes up by 4.1%. EBITDA grew by 14.5% with 284bps of margin expansion.
  • Commercial highlights: Our above core beer brands led our performance this year, delivering low-teens volume growth, driven by Budweiser and Corona. Within the core beer segment, the momentum of Brahma continued with a mid-single digit volume increase. We are the leader in no-alcohol beer, with our volumes growing by double-digits, led by Budweiser Zero and Corona Cero. Non-beer performance was led by our low- and no-sugar portfolio, which grew volumes in the low-twenties. We continued to progress our digital initiatives, with BEES Marketplace growing GMV by 47% versus FY23, and our digital DTC platform, Zé Delivery, generating over 66 million orders in FY24, a 10% increase versus last year.

Europe: Market share gain and margin recovery drove double-digit bottom-line growth

  • Operating performance:
    • 4Q24: Revenue declined by low-single digits with low-single digit revenue per hl growth driven by continued premiumization. Volumes declined by mid-single digits, estimated to be in-line or outperforming a soft industry across the majority of our key markets. EBITDA grew by approximately 20% with margin recovery.
    • FY24: Revenue and revenue per hl increased by low-single digits with slight volume growth, outperforming the industry in 5 of our 6 key markets according to our estimates. EBITDA grew by mid-teens with margin recovery driven by top-line growth and cost efficiencies.
  • Commercial highlights: The beer category remained resilient in FY24, estimated to have gained share of total alcohol in 5 of our 6 key markets and with our own volumes growing year-on-year. We continued to premiumize our portfolio, with our premium and super premium portfolio making up approximately 57% of our FY24 revenue. Our performance this year was driven by our megabrands, Corona and Stella Artois, which successfully activated the category in key moments such as the Olympic Games, Roland Garros and Wimbledon. In the UK, as of January 2025, we have strengthened our portfolio with the addition of the San Miguel brand and are now the leading brewer in the industry. In no-alcohol beer, we expanded the availability of Corona Cero to 27 markets, growing volumes by strong double-digits.

South Africa: Market share gain and margin expansion drove double digit top- and bottom-line growth

  • Operating performance:
    • 4Q24: Revenue increased by low-teens with revenue per hl growth of low-single digits, driven by revenue management initiatives and continued premiumization. Volumes grew by low-teens, outperforming the industry according to our estimates, with increased production capacity enabling us to meet the strong consumer demand for our brands. EBITDA grew by high-single digits.
    • FY24: Revenue increased by low-teens with mid-single digit revenue per hl growth. Volume grew by mid-single digits, estimated to have outperformed the industry in both beer and Beyond Beer. EBITDA increased by high-teens with margin expansion.
  • Commercial highlights: The beer industry returned to volume growth in FY24 following a volume decline in FY23. The momentum of our business continued, with focused investments in our megabrands increasing the Brand Power of our portfolio and driving estimated market share gains in both beer and Beyond Beer. Our performance was led by our above core beer brands, which grew volumes by low-teens driven by Corona and Stella Artois, while our core beer portfolio continued to grow, delivering a mid-single digit volume increase. In Beyond Beer, our portfolio grew volumes by high-single digits driven by Brutal Fruit, Flying Fish and Redd’s.

China: Revenue declined by double-digits, impacted by soft industry

  • Operating performance:
    • 4Q24: Volumes declined by 19.0%, underperforming a soft industry according to our estimates, with our performance impacted by inventory management, which accounted for approximately one third of our volume decline, and continued weakness in the on-premise channel. Revenue per hl decreased by 1.4%, driven by negative channel mix, resulting in a revenue decline of 20.1%. EBITDA declined by 8.9% with cost efficiencies partially offsetting top-line performance.
    • FY24: Revenue declined by 13.1% with revenue per hl declining by 1.4% and volumes decreasing by 11.8%. EBITDA declined by 11.9% with margin expansion of 48bps.
  • Commercial highlights: We remain focused on the execution of our strategy, centered on premiumization, channel and geographic expansion, and digital transformation. In FY24, our premium and super premium portfolio contributed approximately two-thirds of our revenue with Budweiser distribution now expanded to 235 cities. We continued to invest in our brands and innovations to provide balanced choices to our consumers with the expansion of zero sugar options. In the context of a soft on-premise channel, we accelerated our premiumization of the in-home channel with the expansion of our premium and super premium brands. The roll out and adoption of the BEES platform continued, as of December 2024, BEES is present in more than 320 cities with approximately 80% of our revenue generated through digital channels.

Highlights from our other markets

  • Canada: Revenue grew by high-single digits this quarter with mid-single digit revenue per hl growth. Volumes grew by mid-single digits, outperforming an improved beer industry according to our estimates. Our performance was led by Michelob Ultra, Busch and Corona, which were three of the top five volume share gainers in the industry. In FY24, revenue declined by low-single digits with a revenue per hl increase of low-single digits driven by revenue management initiatives and premiumization. Volumes declined by low-single digits.
  • Peru: Revenue and revenue per hl grew by mid-single digits this quarter, driven by revenue management initiatives. Volumes grew by low-single digits, estimated to be in-line with the industry, which returned to growth in an improving consumer environment. In FY24, revenue increased by low single-digits with revenue per hl growth of mid-single digits. Volumes declined by low-single digits outperforming a soft industry according to our estimates.
  • Ecuador: Revenue grew by low-single digits in both 4Q24 and FY24, with performance led by our core beer portfolio which grew revenue by mid-single digits in both the quarter and the full year. Volumes declined by low-single digits in Q4 and were flat for FY24, estimated to be in-line with the industry which was negatively impacted by rolling blackouts and lower consumer confidence.
  • Argentina: Volumes declined by mid-teens in 4Q24 and by high-teens in FY24, estimated to be in-line with the industry, as overall consumer demand was impacted by inflationary pressures. For FY24, the definition of organic revenue growth in Argentina has been amended to cap the price growth to a maximum of 2% per month. Revenue grew by low-teens in 4Q24 and by mid-single digits in FY24 on this basis.
  • Africa excluding South Africa: In Nigeria, revenue grew by strong double-digits in both 4Q24 and FY24, driven by revenue management initiatives in a highly inflationary environment. Beer volumes grew by mid-single digits in 4Q24 and by low-teens in FY24, cycling a soft industry.
    In our other markets, we grew volume in aggregate by low-single digits in 4Q24 and by mid-single digits in FY24, driven by Tanzania, Zambia, Botswana and Ghana.
  • South Korea: Revenue increased by high-single digits in 4Q24 with low-single digit revenue per hl growth. Driven by our core portfolio and innovations, volumes increased by high-single digits in 4Q24 and by mid-single digits in FY24, outperforming the industry in both the on-premise and in-home channels and reaching our highest market share in the last 10 years. Revenue increased by low-teens in FY24 with high-single digit revenue per hl growth, driven by revenue management initiatives and positive mix.

Consolidated Income Statement

Figure 3. Consolidated income statement (million USD)


4Q23


4Q24


Organic


growth

Revenue


14 473


14 841


3.4%

Cost of sales


-6 679


-6 645


0.0%

Gross profit


7 794


8 197


6.3%

SG&A


-4 537


-4 603


-1.7%

Other operating income/(expenses)


234


231


-2.3%

Normalized profit from operations (normalized EBIT)


3 491


3 824


12.0%

Non-underlying items above EBIT (incl. impairment losses)


-165


269


Net finance income/(cost)


-1 290


-958


Non-underlying net finance income/(cost)


550


-701


Share of results of associates


95


103


Non-underlying share of results of associates


-35


-


Income tax expense


-376


-848


Profit


2 270


1 691


Profit attributable to non-controlling interest


379


471


Profit attributable to equity holders of AB InBev


1 891


1 220


Normalized EBITDA


4 877


5 245


10.1%

Underlying profit attributable to equity holders of AB InBev


1 661


1 770


FY23


FY24


Organic


growth

Revenue


59 380


59 768


2.7%

Cost of sales


-27 396


-26 744


0.5%

Gross profit


31 984


33 024


5.4%

SG&A


-18 172


-18 341


-2.0%

Other operating income/(expenses)


778


779


-0.3%

Normalized profit from operations (normalized EBIT)


14 590


15 462


9.4%

Non-underlying items above EBIT (incl. impairment losses)


-624


25


Net finance income/(cost)


-5 033


-4 358


Non-underlying net finance income/(cost)


-69


-995


Share of results of associates


295


329


Non-underlying share of results of associates


-35


104


Income tax expense


-2 234


-3 152


Profit


6 891


7 416


Profit attributable to non-controlling interest


1 550


1 561


Profit attributable to equity holders of AB InBev


5 341


5 855


Normalized EBITDA


19 976


20 958


8.2%

Underlying profit attributable to equity holders of AB InBev


6 158


7 061


In FY24, Ambev recognized 49 million USD income in other operating income related to tax credits (FY23: 44 million USD). The year-over-year change is presented as a scope change and does not affect the presented organic growth rates.

Non-underlying items above EBIT & Non-underlying share of results of associates

Figure 4. Non-underlying items above EBIT & Non-underlying share of results of associates (million USD)


4Q23


4Q24


FY23


FY24

Restructuring


-64


-60


-142


-156

Business and asset disposal (incl. impairment losses)


-23


331


-385


183

Claims and legal costs


-66


-


-85


-

AB InBev Efes related costs


-12


-2


-12


-2

Non-underlying items in EBIT


-165


269


-624


25

Non-underlying share of results of associates


-35


-


- 35


104

EBIT excludes positive non-underlying items of 269 million USD in 4Q24 and 25 million USD in FY24. Business and asset disposal (including impairment losses) for FY24 mainly comprised a gain of 437 million USD recognized upon the sale of our share in associate Ghost Beverages LLC, partially offset by impairment losses of intangible assets and other non-core assets sold in the period.

Non-underlying share of results from associates of FY24 includes the impact from our associate Anadolu Efes’ adoption of IAS 29 hyperinflation accounting on their 2023 results.

Net finance income/(cost)

Figure 5. Net finance income/(cost) (million USD)


4Q23


4Q24


FY23


FY24

Net interest expense


-712


-667


-3 131


-2 846

Net interest on net defined benefit liabilities


-26


-21


-90


-89

Accretion expense


-228


-177


-808


-722

Net interest income on Brazilian tax credits


61


47


168


142

Other financial results


-385


-139


-1 172


-843

Net finance income/(cost)


-1 290


- 958


-5 033


-4 358

Non-underlying net finance income/(cost)

Figure 6. Non-underlying net finance income/(cost) (million USD)


4Q23


4Q24


FY23


FY24

Mark-to-market


294


-940


-325


-1 211

Gain/(loss) on bond redemption and other


256


239


256


216

Non-underlying net finance income/(cost)


550


-701


-69


-995

Non-underlying net finance cost in FY24 includes mark-to-market losses on derivative instruments entered into in order to hedge our share-based payment programs and shares issued in relation to the combination with Grupo Modelo and SAB.

The number of shares covered by the hedging of our share-based payment program, the deferred share instrument and the restricted shares are shown in figure 7, together with the opening and closing share prices.